
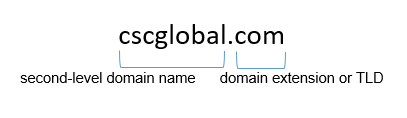
A domain name consists of two main elements: the second-level domain name to the left of the dot—often consisting of a brand name or relevant keywords—and the domain extension or top-level domain (TLD) to the right of the dot. Domain names form the key elements of the readable web addresses allowing users to access pages on the internet and also allow the construction of email addresses.
There are different types of TLDs, including generic or global (gTLDs), that were originally intended to provide a description of the site type, such as .COM for company websites or .ORG for charitable organizations. There are also country-code TLDs (ccTLDs) for specific countries, e.g., .CO.UK for the U.K., .FR for France, etc. Finally there are a range of new gTLDs that have launched since 2013[1], usually relating to specific content types, business areas, interests, or geographic locations (e.g., .SHOP, .CLUB, .TOKYO). Each TLD is overseen by a registry organization, which manages its infrastructure.
Domain names are associated with the full spectrum of internet content, from legitimate use by brands or individuals, to infringing or criminal activity. CSC has observed that certain TLDs get used more for egregious content.
There are several possible reasons why particular TLDs are more attractive to infringers, including the cost of domain registration, and difficulties in conducting enforcement (takedown) actions against infringing content. TLDs operated by certain registries, like those offering low- or no-cost domain registrations or those with lax registration security policies, are more likely to be used for infringing activities. Additionally, domain extensions lacking well-defined, reliable enforcement routes like .VN (Vietnam) and .RU (Russia) prove to be especially high risk. Other factors are also significant; for example, a country’s wealth affects the levels of technical expertise of internet service providers (ISPs) and therefore the likelihood of domains being compromised.
In this two-part blog post, we aim to quantify the threat levels associated with specific domain extensions, i.e., the likelihood that a domain on a particular TLD might be registered for fraudulent purposes.
Part 1: Phishing site TLDs
Determining the overall threat frequency for each TLD is useful in several ways:
- Helping to prioritize results identified via a brand protection service. For example, the TLD can be used to identify top targets for future tracking for content changes.
- Identifying TLDs where it’s advisable to register domains featuring key brand-related strings defensively to avoid them being registered by third parties with malicious intent.
- Identifying TLDs where it’s advantageous for brand protection service providers to offer blocks or alerts when, for example, a third party attempts to register a domain containing a brand-related term.
Analysis and discussion
For this first post, we analyzed data from CSC’s Fraud Protection services to uncover the TLDs associated with domains used for phishing activity. The analysis covers all sites detected between November 2021 and April 2022 for those TLDs with more than 10 phishing cases and where domain-based phishing cases were recorded (as opposed to subdomain-based). This yielded results for 115 distinct TLDs.
In addition, we also consider the frequency of domain use associated with threatening content across the TLD in question. We do this by expressing the raw numbers as a proportion of the total number of domains registered across the TLD[2]. We then normalize the data, so the value for the highest-threat TLD is 1, with all other values in that dataset scaled accordingly. It’s important to note that this value reflects the proportion of malicious domains across each TLD, rather than absolute numbers. Some other TLDs see high numbers of infringements by virtue of the total numbers of domain registrations across these extensions. Table 1 shows the top 20 TLDs represented in CSC’s phishing dataset (by absolute numbers), together with the normalized threat frequencies for these TLDs.
| TLD | % of total phishing cases | Total no. of regd. domains across TLD | Normalized threat frequency within dataset |
| .COM | 45.7% | 221,858,334 | 0.014 |
| .ORG | 6.9% | 15,550,733 | 0.031 |
| .APP | 6.2% | 1,155,807 | 0.377 |
| .NET | 4.8% | 19,773,315 | 0.017 |
| .XYZ | 2.5% | 10,841,304 | 0.016 |
| .RU | 2.5% | 10,627,033 | 0.016 |
| .CO | 2.1% | 4,110,132 | 0.035 |
| .CN | 1.7% | 25,147,816 | 0.005 |
| .ME | 1.3% | 1,669,800 | 0.054 |
| .DEV | 1.2% | 391,929 | 0.222 |
| .BR | 1.2% | 5,519,378 | 0.015 |
| .TOP | 1.2% | 8,830,142 | 0.009 |
| .IO | 1.1% | 923,588 | 0.085 |
| .IN | 1.1% | 3,271,337 | 0.023 |
| .PAGE | 1.0% | 368,474 | 0.195 |
| .ID | 0.9% | 760,240 | 0.080 |
| .ICU | 0.8% | 7,956,385 | 0.007 |
| .INFO | 0.8% | 7,852,896 | 0.007 |
| .DE | 0.7% | 22,881,115 | 0.002 |
| .KE | 0.7% | 165,907 | 0.288 |
We’ve observed similar patterns in other analyses of threatening content. Interisle’s “Malware Landscape 2022” study found that the top 10 TLDs associated with malware domains also featured a mix of legacy gTLDs (.COM at position one, .NET at five, .ORG at six, and .BIZ at 10), new gTLDs (.XYZ at position two, .CLUB at seven, and .TOP at nine) and ccTLDs (.BR, .IN, and .RU at positions three, four, and eight, respectively)[3]. Eight of these 10 extensions feature in the top 14 of CSC’s phishing list above. Similarly, the Anti-Phishing Working Group’s (APWG’s) “Phishing Activity Trends Report” for Q4 2021 analyzed top phishing TLDs, with a top nine including new gTLDs .XYZ, .BUZZ, and .VIP, and ccTLDs .BR and .IN, alongside legacy gTLDs.
New gTLDs were more than twice as extensively represented in the dataset as would be expected purely based on the total number of domains registered across these extensions[4]. A Q1 2022 study by Agari™ and PhishLabs also showed similar patterns, where the top 10 TLDs abused by phishing (by number of sites) included the new gTLDs .VIP, .XYZ, and .MONSTER, and ccTLDs .BR, .LY, and .TK[5],[6].
Table 2 shows the pattern is rather different when looking at the top TLDs by their normalized threat frequency; the list is dominated by a distinct set of ccTLDs, a smaller number of new gTLDs, and excludes many of the more popular TLDs shown previously.
| TLD | Normalized threat frequency within dataset | Total no. of regd. domains across TLD | % of total phishing cases |
| .GD | 1.000 | 3,306 | 0.05% |
| .GY | 0.910 | 4,037 | 0.05% |
| .MS | 0.739 | 9,440 | 0.10% |
| .ZM | 0.531 | 4,838 | 0.04% |
| .APP | 0.377 | 1,155,807 | 6.21% |
| .LY | 0.356 | 25,801 | 0.13% |
| .KE | 0.288 | 165,907 | 0.68% |
| .DEV | 0.222 | 391,929 | 1.24% |
| .PAGE | 0.195 | 368,474 | 1.03% |
| .UG | 0.187 | 10,810 | 0.03% |
| .SN | 0.187 | 9,842 | 0.03% |
| .DO | 0.176 | 30,215 | 0.08% |
| .BD | 0.127 | 37,465 | 0.07% |
| .SBS | 0.120 | 44,222 | 0.08% |
| .NP | 0.112 | 57,379 | 0.09% |
| .SH | 0.110 | 25,070 | 0.04% |
| .NG | 0.097 | 240,668 | 0.33% |
| .IO | 0.085 | 923,588 | 1.11% |
| .ID | 0.080 | 760,240 | 0.86% |
| .SA | 0.079 | 60,246 | 0.07% |
In the second article in this series, we compare these findings with those from additional datasets to produce an overall measure of TLD threat frequency, considering a range of fraudulent uses. We then consider cybersecurity implications, discuss mediation measures, and cover how CSC can help with this process.
[1] newgtlds.icann.org/en/program-status/delegated-strings
[2] domainnamestat.com/statistics/tldtype/all (statistics correct as of June 13, 2022)
[3] interisle.net/MalwareLandscape2022.pdf
[4] docs.apwg.org/reports/apwg_trends_report_q4_2021.pdf
[5] info.phishlabs.com/hubfs/Agari%20PhishLabs_QTTI%20Report%20-%20May%202022.pdf
[6] tripwire.com/state-of-security/security-data-protection/phishing-threat-trends-intelligence-report/